Six Months Into the Pandemic, Illinois and COVID-19 by the Numbers
Six months ago on the first Monday of March, Gov. JB Pritzker and Illinois Department of Public Health Director Dr. Ngozi Ezike stood in front of reporters announcing a fourth case of the novel coronavirus had been confirmed in Illinois. The press conference exercise would be repeated twice more that week, as Pritzker and Ezike announced a fifth and then a sixth case.
In mid-February, IDPH announced Illinois was the first state in the nation to be able to test for this new disease, though test results would have to be sent to the Centers for Disease Control to confirm a diagnosis. On March 5, Prizker said COVID-19 tests had a five-hour turnaround at state-run labs.
But each announcement of more cases of COVID-19 within Illinois’ borders became a little more uneasy, and within a week — the day the World Health Organization declared COVID-19 a global pandemic — Pritzker was sounding the alarm on a testing shortage.
“We need not thousands of tests, but tens of thousands and hundreds of thousands of tests available,” Pritzker said in response to my question about whether Illinois might run out of COVID-19 tests or have to ration them. “We don’t have them.”
Of course, Illinois never ran out of COVID-19 tests, but Pritzker’s administration was put in the position of competing against other states for testing supplies, along with personal protective equipment and ventilators as the weeks dragged on.
As schools and major portions of Illinois’ economy were ordered to shutter and Illinoisans stayed in their homes in order to #FlattenTheCurve, COVID-19 cases multiplied, growing by hundreds and then thousands daily. The first death was reported. Then three more. Six months on, Illinois has now seen over 8,000 COVID-19 deaths.
Illinois reached a peak at some point in May. It’s hard to tell when, exactly, because each of the metrics you’d use to measure are imperfect. The number of new cases reported to IDPH daily, for example, reached a sort of peak in late April/early May, and fell to a low point in mid-June. As the summer has worn on, we’re seeing the raw number of new cases on the rise in Illinois.

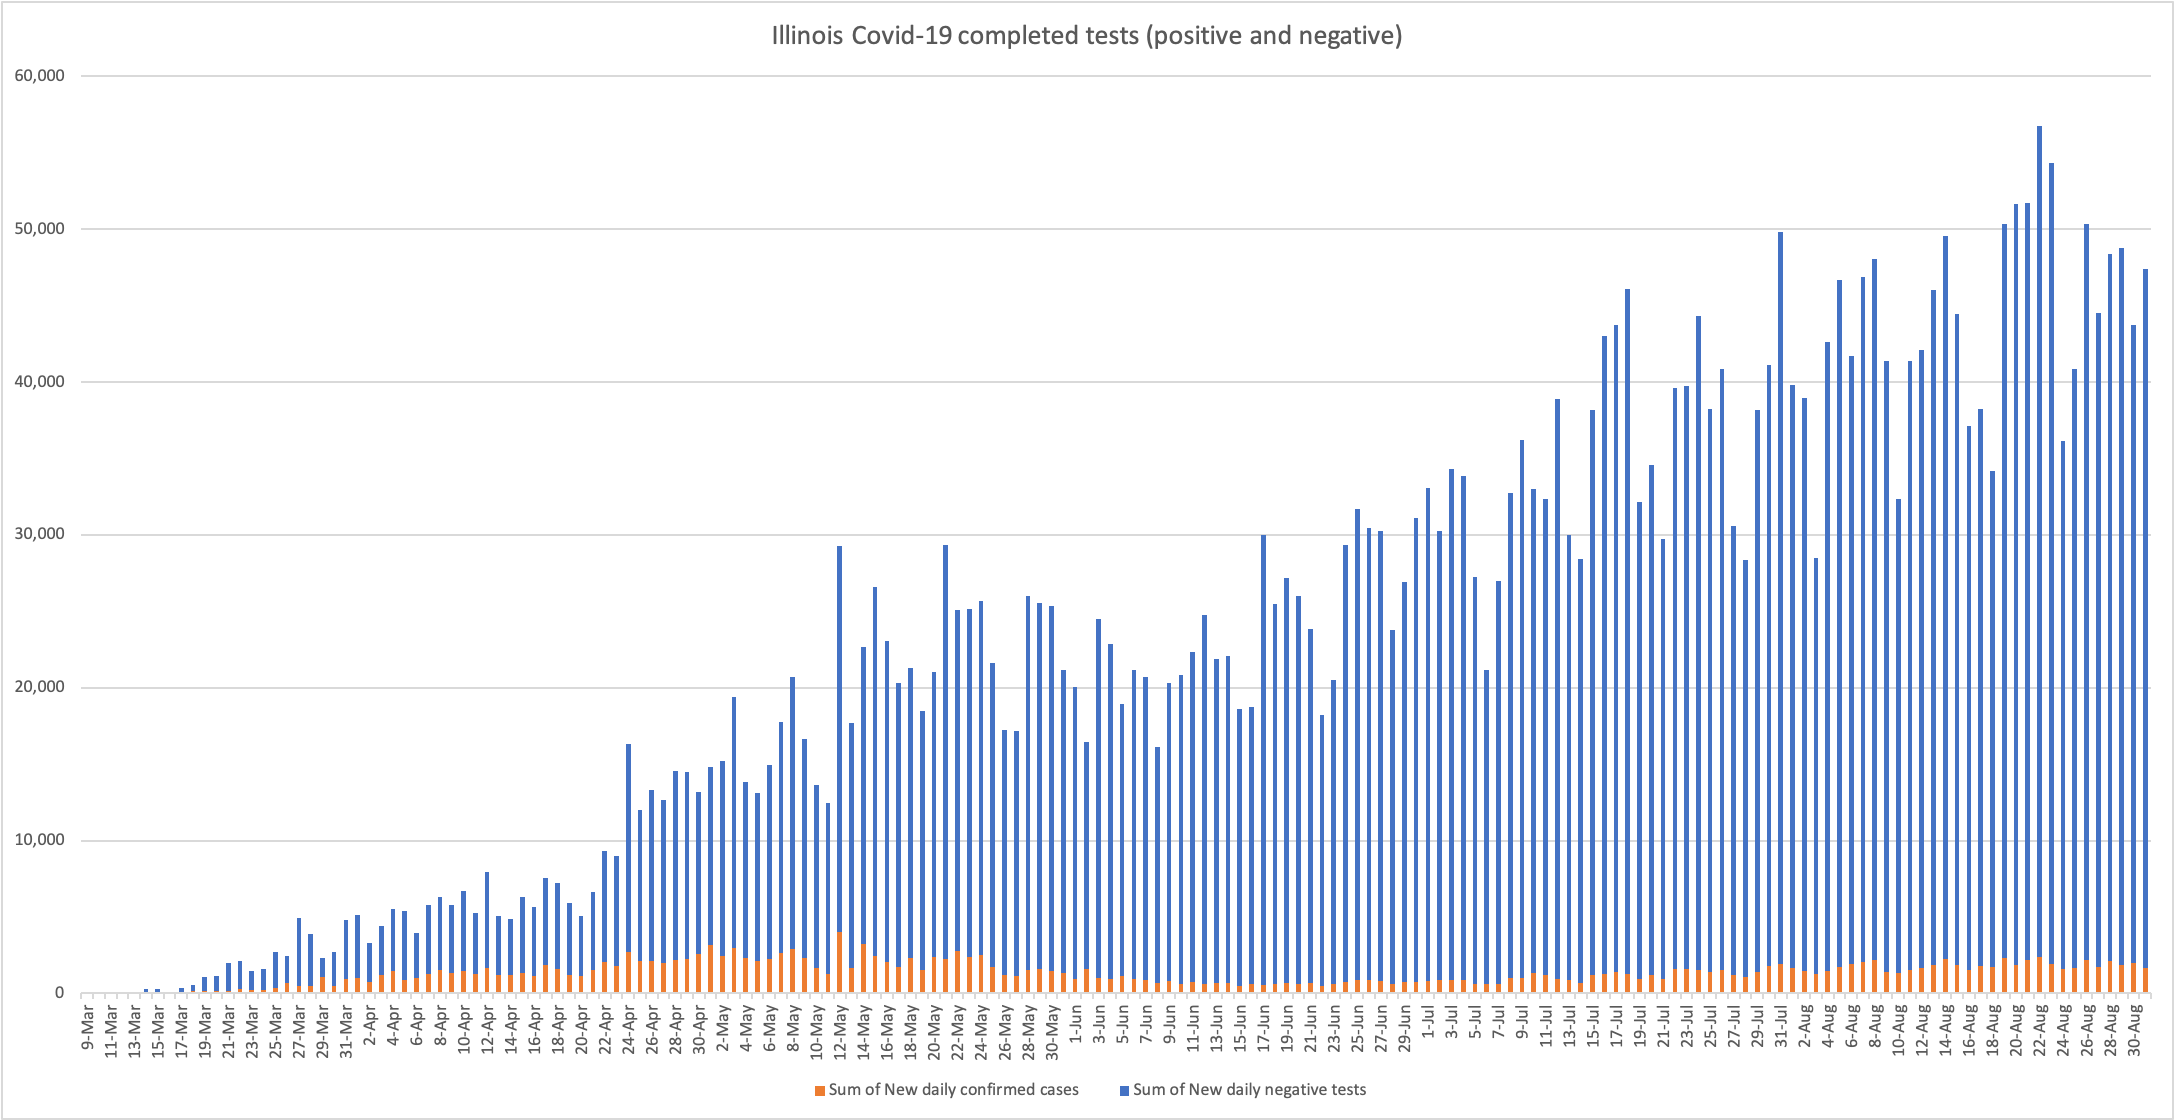
However, you also have to take into account the fact that Illinois has nearly doubled the average amount of tests processed daily since May. In mid-May, state-run and private laboratories, plus hospitals and other settings with access to rapid test machines were testing approximately 25,000 specimens per day. Illinois now sees an average of nearly 50,000 tests reported per day, and hit an all-time daily high of 56,766 test results reported to IDPH last month.

Here’s another way to think about these numbers: The orange represents positive tests and the blue is negative tests. Both taken together is the total amount of test results reported to IDPH on any given day.
The test/case metric that’s most easily digestible is the positivity rate. But even that’s not a perfect metric, because it can be volatile and cease to be so useful if the sample size of people tested is too small or too heavily concentrated on people who are likely sick. Later we’ll discuss a flood of tests resulting in the opposite effect. Illinois’ positivity rate swung wildly in March when very few people were being tested. It wasn’t until June that anyone in Illinois who wanted a Covid-19 test could get one, allowing for better detection of cases in those who are asymptomatic.

Two important developments have happened over the summer that deserve Illinoisans’ full understanding as the state heads into Fall, some schools and universities are open for classes and businesses try to adapt to a new world of face masks and social distancing while waiting to see how the Nov. 3 election and a long-forewarned “second wave” of COVID-19 pan out.
11 Regions, 8% trigger point
In mid-July, Pritzker announced a significant update to his so-called “Restore Illinois” plan for the state’s economic reopening. Instead of the four large regions the state had been split into under the governor’s earlier plan, Illinois is now delineated into 11 regions, mostly along decades-old EMS region lines.

A few weeks prior to the change, the state entered Phase 4 of Pritzker’s reopening plan, which included allowing indoor restaurant and bar service, along with gatherings of up to 50 people. Entertainment venues like movie theaters and casinos were reopened on July 1 with capacity limits. Child care, children’s camps and schools were also able to reopen, though a majority of Illinois students will begin their school years remotely, according to a survey conducted by the Illinois State Board of Education.
As you can see below, it didn’t take a terribly long time for the positivity rate in each of Illinois’ 11 regions to start ticking upward after the state entered into Phase 4 on June 26. Chicago followed the rest of the state on July 1.

Region 4 — the seven-county cluster known as the Metro East near St. Louis — saw a significant rise in its positivity rate a week before there even was a “Region 4” to speak of. The rise continued to blow past the 8% positivity trigger point in early August, showing no signs of turning around, despite mitigations put on the region, which we’ll discuss later.

Region 7 — Kankakee and Will counties — also passed the 8% positivity trigger point later in August, and has now been under mitigations for nearly a week.

Here are the ways in which a region’s reopening can be put on ice if its cases or hospitalizations begin to increase. So far, no region has gotten truly close to achieving a setback via the first pathway: Seven days of rising positivity plus rising hospitalization stats.

For the purposes of Pritzker’s Restore Illinois plan, positivity rates are measured on a 7-day rolling average. Recently I’ve become very curious about the actual number of positive cases and tests performed in each region, especially as one region in particular has far outstripped the rest of the state in testing, and achieved an incredibly low positivity rate as a result.
Cutting edge test floods state stats
Region 6, which includes 21 counties in East Central Illinois, is home to the University of Illinois at Urbana-Champaign, which developed its own saliva-based COVID-19 test earlier this year. The test, which received emergency FDA approval last month is an integral part of UIUC’s reopening plan. Students and faculty are required to get tested twice per week, which has ballooned testing numbers in Region 6 and kept the region’s positivity rate down below a 2% rolling average since classes began.
At a press conference announcing the federal approval last month, Pritzker said he hoped the test could be expanded to the rest of the state later this year. The city of Chicago has been using a different type of saliva test for months. Both saliva tests promise quick results, another advantage to the nasal or throat swab tests that can take days to come back from a busy lab.UIUC’s saliva testing launched on campus earlier this summer, bending the region’s positivity curve downward even before classes resumed.

Even with the low positivity rate, five of Region 6’s 21 counties are currently at “warning level,” IDPH announced last week.
Let’s compare the raw number of cases and tests in Region 6 with Regions 4 and 7. First disclaimer: I only have six days’ worth of data, as IDPH does not make it easily accessible. Second disclaimer: this data purports itself to be current, while the official positivity rates (7-day rolling average the state uses to determine whether a region is heading in the right or wrong direction) is three days behind.

Thanks in large part to the U of I saliva tests and the twice-per-week requirement for university faculty and students, Region 6 is putting up huge numbers for daily tests, and relatively low numbers of actual cases, resulting in low positivity rates. Let’s look at real-time positivity rates for Region 6 below, before they’re smoothed into the 7-day rolling average the state uses.

With a huge amount of testing going on — and the low number of cases detected in proportion — it’s no wonder the state’s overall positivity rate is so much lower than most of the other regions. UIUC’s testing program is dragging down the positivity rate for Region 6, which in turn is dragging the state’s total positivity rate downward.
Let’s turn our attention to Region 4, the Metro East. Region 4 has been subject to mitigation since mid-August, including reduced capacity in restaurants, bars and casinos. However, indoor dining has still been allowed, in order to match regulations across the Mississippi River in the St. Louis area.
In announcing slightly different mitigations for Region 7 last week, including no indoor restaurant or bar service, Pritzker admitted that continuing to allow indoor dining in the Metro East was a “mistake,” especially as Region 4’s positivity rate continues to climb. Here are the raw number of new cases and tests for the last six days and the corresponding raw positivity rates.


The uneven mitigations placed on Region 4 and Region 7 angered local leaders of both parties in the south suburbs. But Region 7 appears to be faring better, and may recover from needing mitigations faster than the Metro East. Here are Region 7’s raw numbers of new cases and tests for the last six days and the corresponding raw positivity rates.


Hospitalizations and deaths
Pritzker has said on many occasions that he takes a closer look at Illinois’ hospitalization stats than the state’s positivity rate in order to determine how the state is handling the pandemic. In the spring, Pritzker and his staff were competing with other states for equipment like ventilators and PPE, making odd deals and occasionally getting price gouged.
After setting up five “alternate care facilities” in order to treat a possible surge of COVID-19 patients this spring, only the field hospital at McCormick Place ever officially opened, and then closed after treating a handful of patients.
While Illinois is far from its peak of hospitalizations and COVID-19 patients needing ICU rooms and ventilators, the state’s hospitalization stats have been stubbornly level since early July, seeing slightly increased numbers in recent weeks.


Finally, Illinois has seen 8,026 COVID-19 deaths since the first official death was reported in mid-March. The true number may be even higher, as this Tribune piece on excess deaths explains. IDPH has yet to report any days without a death in nearly six months.
COVID-19 has hit communities of color disproportionately hard, and you can see that divide especially clearly in the state’s death stats. For further reading, I recommend this expertly reported WBEZ piece. BEZ was the first to sound the alarm on the racial disparities at play during the pandemic back in the spring and has kept bringing that issue to the forefront during the last six months.

Illinois is 61 percent white, but in every age group until age 70, white COVID-19 patients are in the minority of those who have died, despite getting tested much more than other racial groups and testing positive nearly as often as other racial groups, according to IDPH data.
White COVID-19 patients overtake minority groups in deaths in the 70 - 79 and 80+ age range. COVID-19 deaths are also most prevalent among the elderly, and many have died in long-term care facilities. According to IDPH’s last report on Friday, approximately 55% of all of Illinois’ COVID-19 deaths have been long-term care facility residents.
However, only 12% of Illinois’ cases at this point are in long-term care facilities — a stat that keeps falling week over week as younger cohorts are diagnosed more frequently.
There are so many more areas of data to explore as COVID-19 wears on (and on). I’ll be looking at infection stats from college towns and areas where K-12 schools reopened in person in the coming weeks and months.Updating Illinois’ COVID-19 numbers every day gives me some sense of control and understanding of what we’re facing, but looking at the stats day after day isn’t for everyone. I encourage those who are struggling with the pandemic to give yourself a break when you need it. In the meantime, wear a mask, socially distance, support local journalism and take care of yourself and those around you.

Hannah Meisel
Hannah Meisel is an independent journalist with nearly seven years of experience covering Illinois government and politics. She tweets daily COVID-19 charts and updates @hannahmeisel.